
To reflect the volatility and turbulence impacting resource costs across electricity markets, E3 has updated our Resource Cost (RECOST) model, a discounted cash flow tool that calculates the levelized cost of different energy resources through 2050, differentiated for every state in the U.S. and every province in Canada. In this update, E3 is partnering with Halcyon to leverage Halcyon’s Gas Power Plant Tracker.
What is RECOST?
RECOST is E3’s discounted cash flow model used to calculate the levelized costs of different candidate resources, from the present through 2060. Since 2010, E3 has regularly created and released formal public databases and calculations of levelized costs for its clients. Now, RECOST is the foundation of our generation supply costing analysis that is used in the Integrated Resource Plans of utilities, the long-term scenarios of state agencies, and the project or portfolio forecasts of investors and developers negotiating PPAs and planning future project pipeline. Learn more >
What’s New?
There has been significant disruption in the cost of building new gas power plants since 2020. Cost shocks have impacted plants currently in development and plants in the planning stage. Plants in development have been subject to commodity and labor cost increases, including costs associated with finding the necessary workers to build and operate gas power plants as competitive pressure has intensified. Plants in the planning stage have faced the same pressures as plants in development, but have also been subject to the incremental and significant costs associated with procuring new gas combustion turbines from OEMs. The result is that heterogeneity now dominates the gas plant cost landscape, after decades of cost stability and lower demand. Importantly, market observers will see plants coming online in 2026 that appear to be “lower cost” but which actually procured key equipment more than 2 years ago, before the most recent spikes in turbine orders and other equipment became apparent.
Based on research and discussions with developers and utilities, E3 has concluded that purely “bottom-up” or fundamentals-based estimates of new gas plant costs are not appropriate for setting near-term cost expectations (i.e., expectations for new plants reaching COD between 2026 and 2030). To improve the accuracy and robustness of near-term resource cost forecasts for gas plants, E3 is partnering with Halcyon, the AI platform that makes energy information discoverable, to leverage Halcyon’s Gas Power Plant Tracker in this RECOST update.
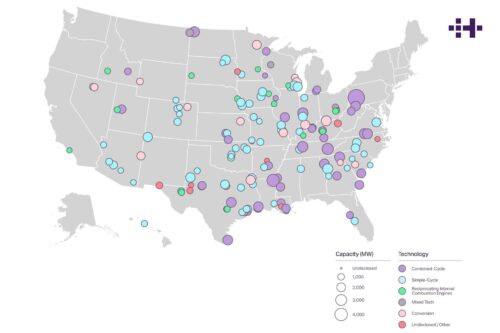
Halcyon’s Gas Power Plant Tracker compiles comprehensive information on newly proposed and in-development natural gas power plants across the United States. Drawing from state public utility commission (PUC) dockets, environmental filings, and the U.S. Energy Information Administration (EIA) datasets, the Tracker consolidates key project details into a structured dataset.
Separate from the gas plant cost update, E3 has updated the following in this quarter’s RECOST update:
- Tariff assumptions have been updated and applied across U.S. trading partners, impacting every technology but especially technologies dependent upon imports from China
- Consistent with previous RECOST updates, E3 has also updated our market data for financing costs across resources
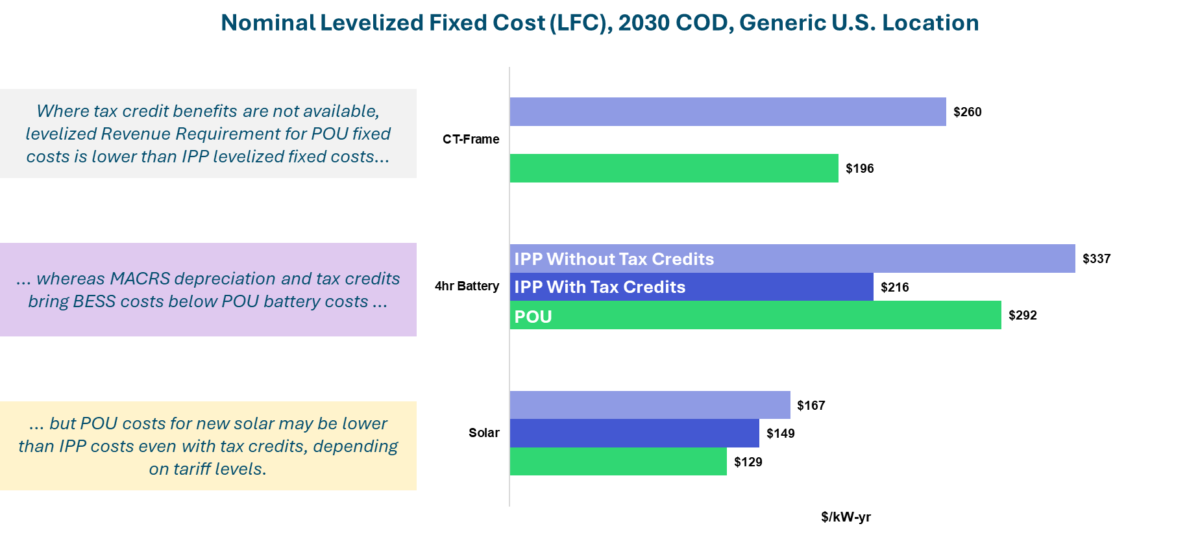
- RECOST can now calculate the annual and levelized revenue requirement for new resources, applicable to any publicly owned utility (POU) analysis
- Pending final guidance on Foreign Entities of Concern (FEOC) requirements to qualify for federal tax credits, E3 has introduced updates to reflect the fundamental economic choice: should projects seek to onshore their supply chains or remain dependent on foreign imports?
In our Q1 2026 update, we find that:
- New gas plant costs continue to rise dramatically but with a wide band of uncertainty: we expect the median nominal cost of new frame Combustion Turbine plants to reach ~$1700/kW for plants reaching COD in 2030; median CCGT build costs are expected to reach ~$2500/kW.
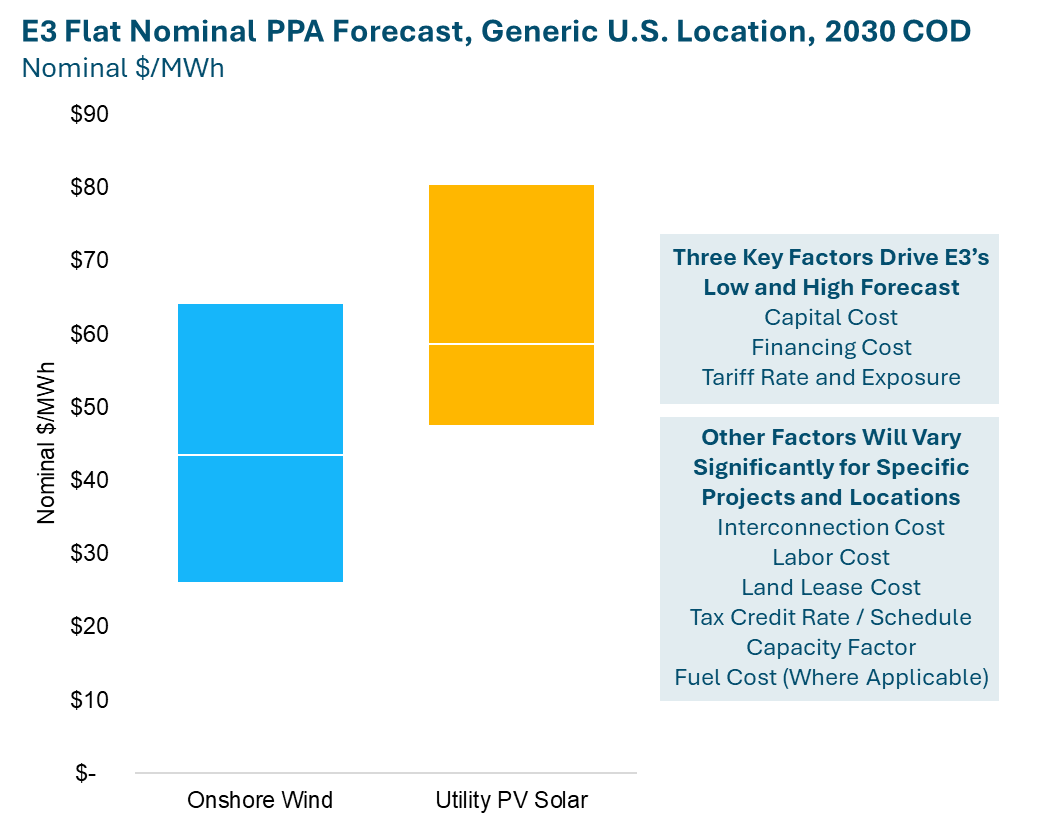
- The abatement of the most severe potential tariff impacts visible in summer 2025 leads to a material reduction in the near-term cost of new solar and battery energy storage (BESS) assets.
- Even with reduced tariff impacts, new solar PPAs for high-capacity factor resources could still reach $80/MWh by 2030; wind PPA costs are expected to be lower in economic terms, but the significant development headwinds facing onshore wind are likely to increase the economic cost beyond calculated levels.
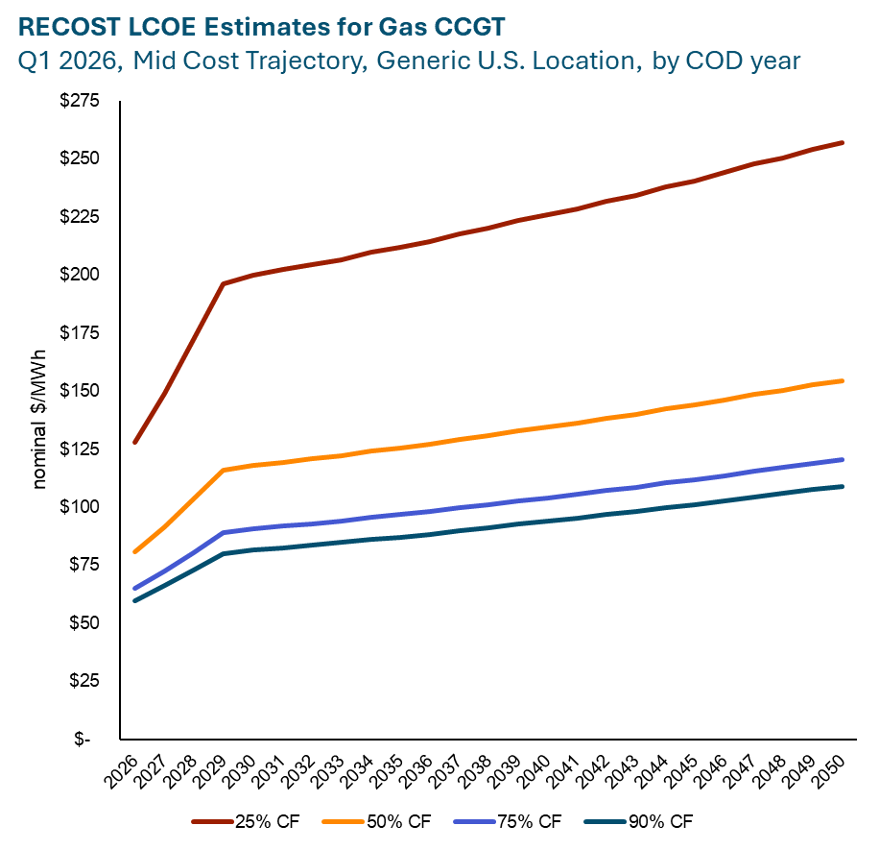
The LCOE estimates shown above are shaped in large part by our upfront capital cost expectations. Near-term cost increases are driven by supply shortages of new turbines relative to demand, increases in labor costs, and increases in interconnection costs. We expect moderation post-2030 as demand and supply both adapt to the current market.
What’s Next
E3 has updated RECOST using the latest market data and internal expertise. In future updates, E3 expects to add the Investor Owned Utility (IOU) perspective, the ability to sculpt debt dynamically to project cash flows, and deeper investigation of the dynamics surrounding effective net Cost of New Entry (CONE).
The RECOST model is completely customizable to client views on financing, timeline, capital costs, and operating costs for the creation of custom views relative to E3 perspectives. RECOST is available for purchase along with our latest market views on our website. For more information, reach out to E3 at marketprices@ethree.com.