
E3 has released the Q1 2026 update to our off-the-shelf electricity market price forecasts, reflecting our latest, comprehensive view of how load growth, technology costs, policy, and market design are reshaping power markets across North America. These forecasts are built through extensive fundamentals-based modeling that integrates long-term resource build decisions, hourly market operations, and evolving system conditions. As markets undergo rapid change, this approach allows us to identify not just price outcomes, but the structural drivers behind them.
One clear insight emerging from our ERCOT forecast over the years is a shift in the relative economics of wind and solar. While recent development has been dominated by solar and battery storage, our modeling shows that large-scale solar additions are fundamentally reshaping net load and price formation. As solar capacity has expanded, daytime prices have been pushed down and the highest-priced hours are increasingly occurring after sunset. This shift has reduced the average prices earned by solar generation, while wind often generates during the evening, when overall market prices are higher. To explore these dynamics in more detail, this companion whitepaper focuses specifically on ERCOT wind economics.
Highlights include:
- Wind capture prices have risen relative to solar and exceeded solar capture prices for the first time as ERCOT’s price peak shifts later in the day.
- Despite improving market fundamentals for wind, the interconnection queue remains heavily skewed toward solar and storage through 2030.
- Over the longer term, continued solar saturation is expected to support a rebalancing of the resource mix, with renewed wind development as market value increasingly concentrates in non-daylight hours.
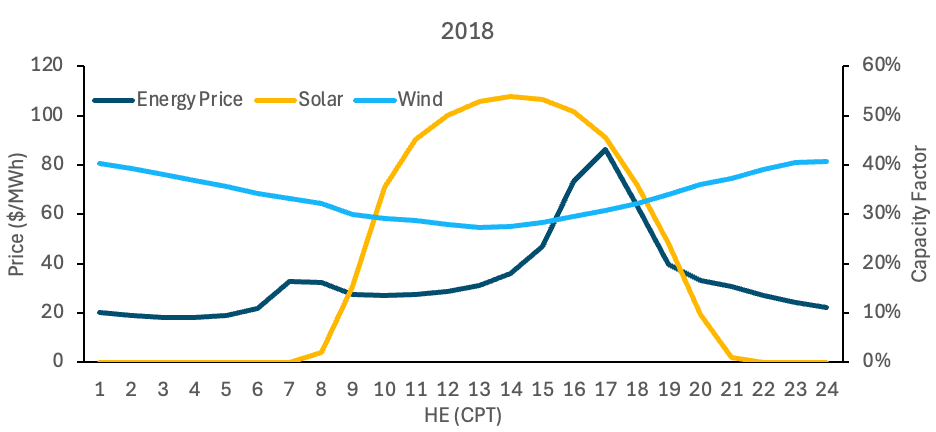
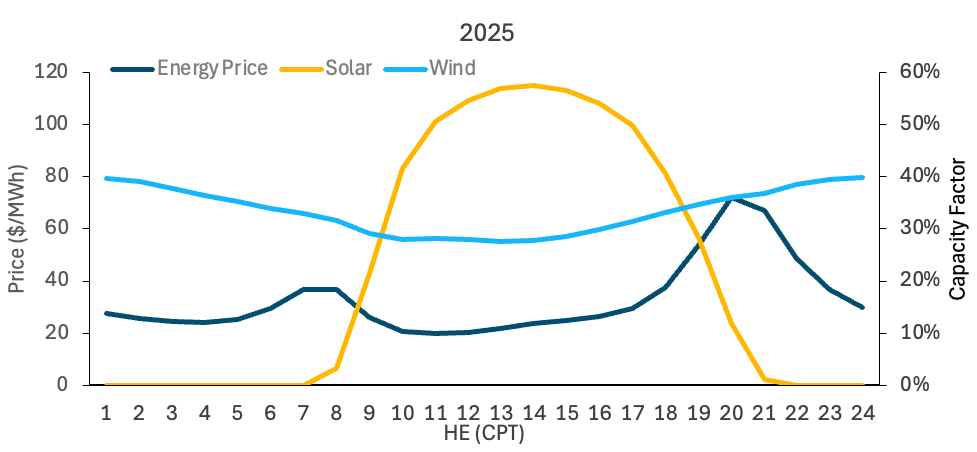
Comparison of 2018 and 2025 Wind and Solar Shapes vs. Price
The full whitepaper draws on historical market data, interconnection queue trends, and results from E3’s latest ERCOT market price forecast to provide a deeper look at how these forces are likely to play out over time.
Download the paper >
E3 is also exploring scenarios where wind development remains at its current run rate to understand a world where development constraints limit the resource – changing the long-run balance of the ERCOT grid. Please contact marketprices@ethree.com for more details.