


Rapid load growth has turned attention to demand response (DR) and other flexible loads as a way to support reliability while new generation and transmission take years to build. The industry has established methods for valuing DR as a capacity resource, but there is little public information on how often DR gets used and how this will change as new loads and resources come online. Recent studies have begun to fill that gap, pointing to roughly 100 hours a year as one reference point (see here and here).
E3’s 2025 whitepaper, The Capacity Accreditation of Demand Response in SPP, estimated how much capacity DR provides in the Southwest Power Pool (SPP). A new 2026 E3 report funded by Google, When and How Much? Demand Response (DR) Utilization Dynamics in MISO and PJM estimates when and how often DR would be called in the Midcontinent Independent System Operator (MISO) and PJM Interconnection (PJM) in 2030, a near-term view grounded in current capacity auction results. Using RECAP, E3’s loss-of-load probability model, the study simulates both systems across thousands of possible years of weather and generator outages. It tracks every DR call for when it happens, how long it lasts, and how much DR is needed.
In the 2030 cases that meet their reliability target, DR is called for about 2-19 hours in an average year, well below the 100-hour reference point. Usage is higher in cases that rely on DR for more of their reliability needs, since they have fewer supply resources to use instead, and in systems that are short on capacity overall, which lean more on every resource. In MISO’s shortfall case, average use reaches 33 hours a year, still low compared with most generation resources.
When DR is called depends on each system’s weather and resource mix. DR is needed whenever demand is high relative to available supply, which isn’t always at peak demand. In MISO, nearly all DR use comes in summer, mostly in the evening, when air conditioning load stays high as solar output fades. PJM’s need is weighted more toward winter; calls in PJM are less frequent but longer, and severe cold can keep DR running for days at a time. That difference helps explain why MISO uses DR more often than PJM: hot summer evenings come most years, while severe winter storms do not.
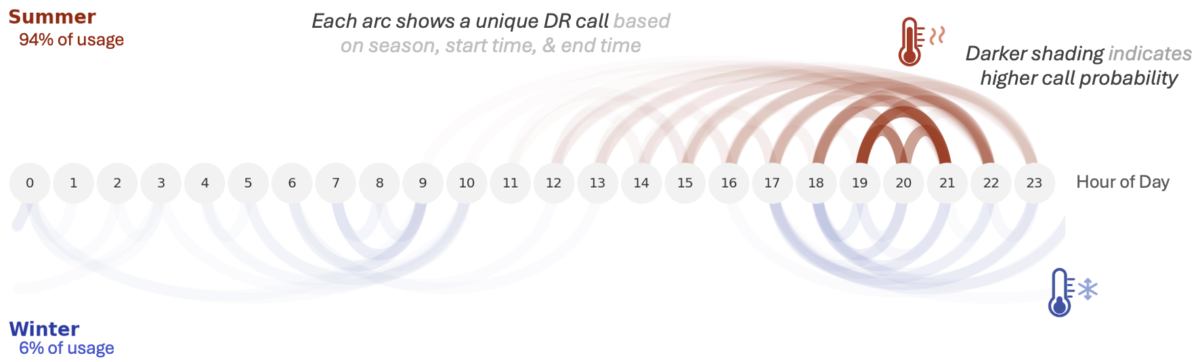
DR usage also swings from year to year with the weather and how well generators perform, so it can’t be known in advance. In a mild year, DR may not be called at all. In PJM, when the system meets its reliability target, that is the most likely outcome. A year with extreme weather and poor generator performance can push usage much higher, up to a program’s call limits where they exist. Even so, years above 100 hours are rare in every scenario.
Any one DR load would be called less often than these fleet-wide totals suggest, since many calls need only part of the DR fleet. If grid operators rotate calls among loads, an individual load in MISO could be called up to about 70% less often than the fleet as a whole. That is a best case. Actual usage depends on where a load is located, how quickly it can respond, and how that region’s operator dispatches it.
Loads that can move their demand to another region may also have an alternative to curtailing. MISO and PJM don’t always need DR at the same time, so a load called in one market could sometimes shift its demand to the other, as long as the receiving system has supply to spare. That works more often from MISO to PJM than the reverse. MISO tends to call DR in milder conditions, when PJM usually has room, while PJM’s calls come during severe weather, when MISO is more likely to need its own DR. Shifting small amounts of load is also feasible more often than shifting large ones.
The results describe the MISO and PJM systems as modeled for 2030, and the timing and frequency of DR calls will change as demand and resource mixes evolve.
Read the full report >
Read E3’s 2025 SPP demand response whitepaper >
For further information on E3’s work in resource adequacy and reliability, please contact zachary.ming@ethree.com.
This report was partially funded by Google LLC (Google), who reviewed the analysis prior to publication. E3 is an independent consulting firm, and all conclusions and analyses are E3’s own.
