

Utilities are being asked to interconnect the nation’s electrifying truck fleets at the same moment rate affordability has become a flashpoint in many state commissions. The question hanging over every planning docket is the same: will electrifying medium- and heavy-duty vehicles raise the bills of residential customers who never plug in a single truck? E3 set out to answer that question rigorously — and the answer, at least in the core scenarios, is no.
In a new white paper funded by Powering America’s Commercial Transportation (PACT), with support from the Edison Electric Institute (EEI), E3 analyzed rate impacts from new MHD vehicle load for PG&E (California) and Georgia Power in 2028 and 2035. The study tested both unmanaged and managed charging scenarios as well as a range of distribution infrastructure cost assumptions. In the core scenarios, MHD vehicle electrification applies neutral to downward pressure on average residential rates in both states because the additional energy sales outpace incremental system costs. This translates to savings of up to ~$20 per year for a typical California household by 2035 and approximately $1 per year in Georgia. The results are not unconditional: high distribution upgrade costs can produce upward pressure in the near term, particularly with unmanaged charging. But the analysis shows that smart siting, managed load, and timely ratemaking updates are sufficient to keep electrification in positive territory for ratepayers.
Results
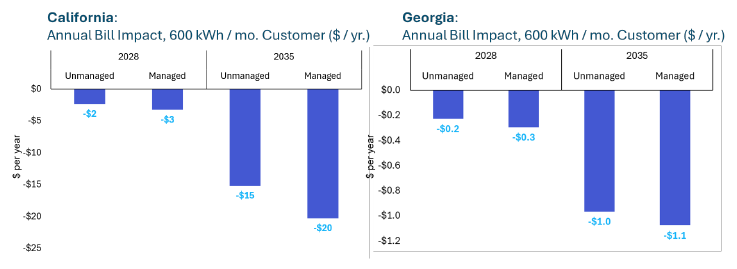
For California (PG&E) using ACC-based marginal costs, MHDV electrification applies downward pressure on average residential rates in both 2028 and 2035, as increased sales outweigh incremental costs. For residential customers, the rate percentage change increases from -0.7% in 2028 to -4.5% in 2035. For a typical customer consuming 600 kWh per month, that translates to annual bill savings of $15-20 by 2035.
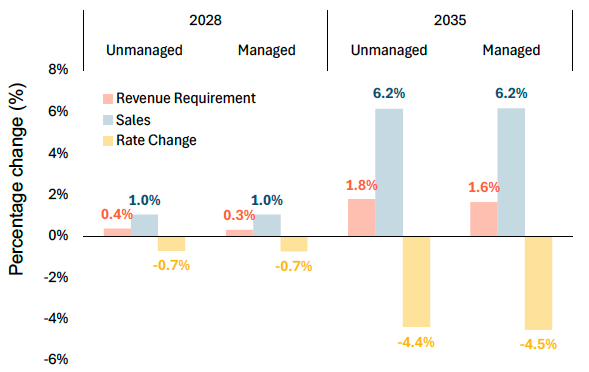
E3 also tested a higher distribution cost sensitivity based on PG&E’s Electrification Impact Study Part 2 and found that average rates experience upward pressure under unmanaged charging, while a conservative managed charging approach returns rate impacts to downward pressure in 2035.
The Georgia Power analysis covers a territory with substantially lower projected MHDV adoption, roughly 9,900 electric MHD vehicles by 2035, with incremental system costs remaining small throughout at $17 to $19 million in 2035. Load growth slightly outpaces cost growth, resulting in very mild downward pressure on system-wide and residential rates across both time horizons. For a typical residential customer consuming 600 kWh per month, bill savings reach approximately $1 per year by 2035.
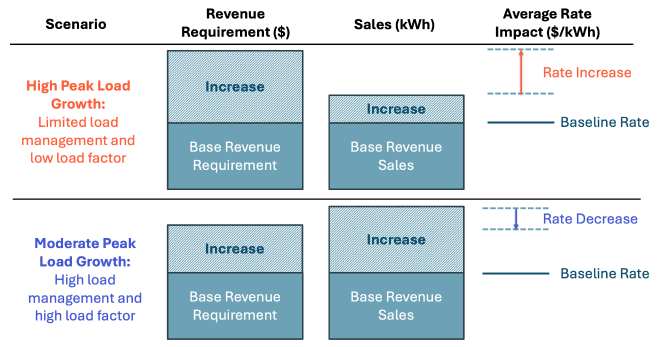
Results show that MHD vehicle electrification applies neutral to downward pressure on residential rates in both California and Georgia in the core scenarios.
Three factors emerge from the analysis as the most influential in determining whether MHDV electrification produces upward or downward rate pressure. Siting MHD charging infrastructure near substations with available capacity reduces the need for costly grid upgrades, directly limiting incremental cost growth. Timely updates to cost allocation ensure that MHD vehicle customers bear an appropriate share of those costs rather than shifting them to the residential class. And tariff design, particularly time-of-use rates and subscription-based access charges, supports load management and reduces the risk that upfront infrastructure investment is stranded by slower-than-expected fleet adoption. Managed charging functions as a least-regrets strategy across all scenarios modeled, reducing both peak demand costs and the sensitivity of rate outcomes to distribution cost assumptions.
Read the full report >
For further information on E3’s work on transportation electrification and rate design, please contact Eric Cutter at eric@ethree.com or Emily Rogers at emily.rogers@ethree.com.
Cover image provided by PACT.