
E3 has partnered with Integral Analytics (IA) to develop Forecasting Anywhere, an approach to geospatial forecasting of electrification load and its effects on the transmission and distribution system. IA provides the LoadSEER software, a leading distribution planning and load forecasting tool implemented at over 15 large utilities in North America, including PG&E, SDG&E, HECO and Xcel. Whereas LoadSEER performs detailed planning with proprietary utility distribution data, Forecasting Anywhere uses a variety of publicly sharable datasets to perform robust scenario analysis for policy and planning.
E3 and IA are developing scenarios for use in distribution system planning by detailing the magnitude and location of new electric loads from vehicle electrification, building electrification, and other decarbonization measures. High resolution geospatial forecasting supports distribution planning that achieves state and utility decarbonization goals, optimizes infrastructure investments, and increases overall distribution system utilization and reliability.
For a typical project, E3 develops three decarbonization scenarios to explore pathways to achieve utility and state climate goals, including economy-wide net-zero GHG emissions by 2050:
- Reference Scenario: This business-as-usual scenario includes existing state and federal climate policies. It shows moderate growth in electricity demand from some electrification.
- Moderate Electrification Scenario: This scenario achieves 2050 net-zero target through high adoption of electric vehicles, heat pumps with gas backup for heating, renewable hydrogen for industry, and other measures. It typically results in a doubling of annual electricity sales by 2050 relative to today.
- High Electrification Scenario: This scenario also achieves 2050 net-zero goal but with greater reliance on electrification. It retires gas heating systems more aggressively, favoring heat pumps with electric backup. This scenario typically shows a tripling of annual electricity sales by 2050. It also exhibits larger winter peak load impacts in cold climates due to the all-electric buildings.
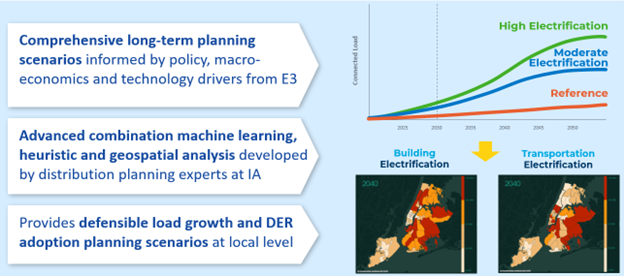
High Electrification Distribution Planning Scenarios
Our approach begins with statewide planning scenarios informed by policy, macro-economics and technology drivers. An advanced combination of machine learning and heuristic analysis developed by the distribution planning experts at Integral Analytics translates statewide forecasts to geospatially granular DER adoption and load forecasts at the parcel level. The results readily aggregate up to census tract, distribution network, disadvantaged community, or other geographies of interest.
Utility distribution plans typically take months to complete, are limited to one planning scenario, and only look ahead 5-10 years. In contrast, Forecasting Anywhere provides a more nimble and data-driven approach to evaluate geospatially-specific distribution and transmission investment needs and costs across a wide range of planning scenarios out to 2050. This will provide more useful insights for planners, policy makers and stakeholders in considering alternative electrification scenarios.
After planning scenarios have been analyzed and refined in Forecasting Anywhere, selected scenarios, such as the Reference, Moderate and High Electrification scenarios described above, can be directly loaded into utility distribution planning tools such as LoadSEER, CYME and Synergi. To ensure safe, reliable, and cost-effective service, it is no longer sufficient to develop distribution plans for a single planning scenario. Planners quickly understand the uncertainties, risks, and opportunities posed by rapid growth in transportation and building electrification, rooftop solar, and energy efficiency needed to achieve city and state decarbonization goals.
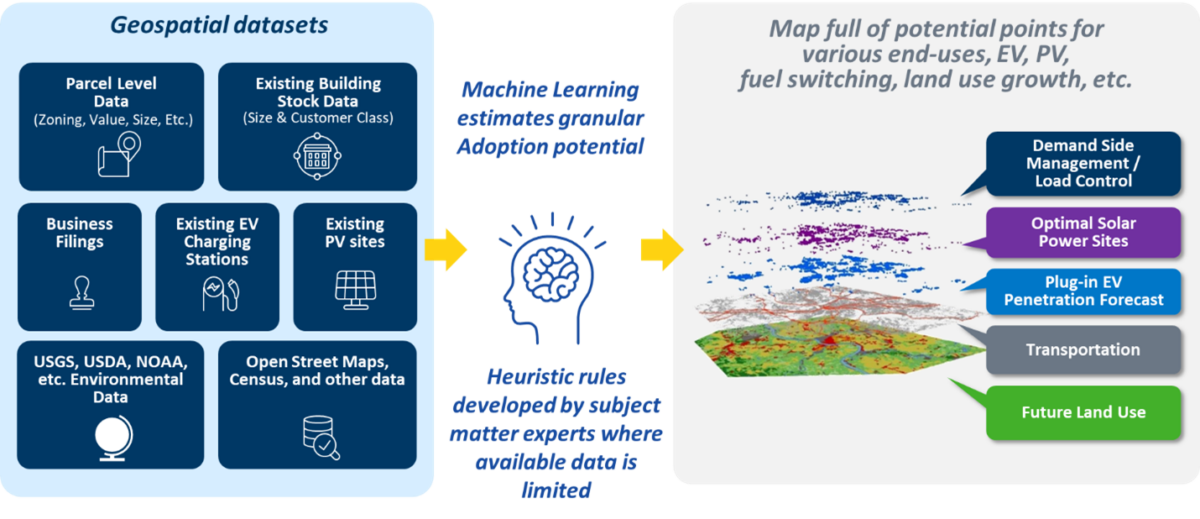
Overview of Datasets Used
Example Results
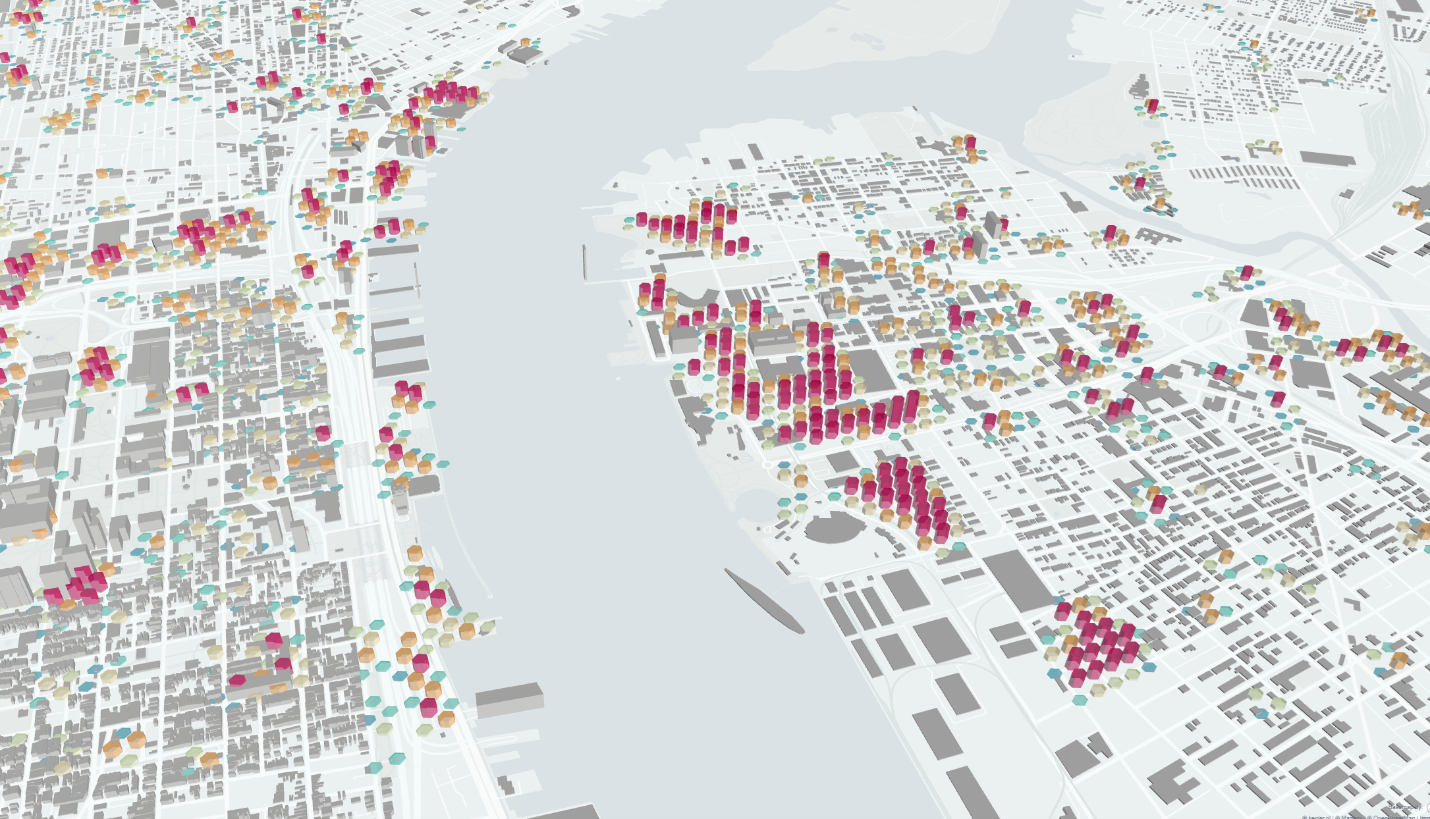
Technical Potential for Workplace L2 Charging
The figure above shows Forecasting Anywhere calculation of the technical potential to install Workplace L2 charging based on several factors including: business type, building and parking lot sq. ft., zoning and land use data.
All Tools