
 In early 2013, California’s five largest electric utilities needed to find out how grid operations would be affected if the state increased its Renewables Portfolio Standard (RPS) to 50 percent by 2030. They turned to E3 to examine operational and cost implications, explore how the utilities could reach the 50 percent RPS goal, and assess how effective a higher RPS would be in reducing GHG emissions.
To ensure objectivity, the utilities assembled an independent advisory board composed of the chief executives of the National Renewable Energy Laboratory, the University of California Energy Institute and the Energy Institute at the Haas School of Business, the Analysis Group, and the Chelan County Public Utility District. Its members committed to an impartial review of the study.
E3 then agreed to conduct the study, with the caveat that we would publish the findings regardless of the research conclusions. ECCO International, DNV GL, and the California ISO (CAISO) also contributed to the project.
We believed an RPS of 50 percent in California would be technically feasible, so we focused our analysis on the costs and benefits of different approaches to meet that goal. To demonstrate what would be needed, our team developed a first-of-its-kind stochastic production simulation cost model called REFLEX, for Renewable Energy Flexibility.
Our analysis showed that achieving a 50 percent RPS would be possible, but not without challenges. We were the first to identify the operational problems that utilities must overcome as well as effective solutions, pinpointing the actions needed to prepare for a high-renewables future.
We delivered the findings to the utilities in January 2014 and then presented the report to the governor and the public. The report, Investigating a Higher Renewables Portfolio Standard in California, “significantly advances our understanding of some of the alternatives available for and implications of moving California toward a greater reliance on renewable energy,” wrote the advisory board.
The study helped shape the dialogue on achieving the higher RPS, and Gov. Jerry Brown embraced the regional approach E3 recommended. In October 2015, he signed California’s landmark Clean Air and Pollution Reduction Act (SB 350), which calls for increasing the state’s renewables portfolio to 50 percent by 2030 and directs the California ISO (CAISO) to study the costs and benefits of a regional energy market.
50 percent RPS is feasible, but is it affordable?
The Los Angeles Department of Water and Power, Sacramento Municipal Utility District, Pacific Gas and Electric Company, Southern California Edison Company, and San Diego Gas & Electric Company knew that state legislators wanted to significantly increase the RPS by 2030 to cut emissions of GHGs and criteria pollutants. While the utilities were on track to meet or exceed California’s existing 33 percent RPS by 2020, they weren’t confident that they could reliably and cost effectively integrate even more variable energy into the grid.
To the utilities, going to 50 percent renewables without investments in renewable grid integration solutions looked like a leap that would be too expensive. For E3, it was an opportunity to bring policy makers together with utilities and market operations to show what is possible when you modify outdated operating assumptions.
Results that challenge conventional wisdom
We needed to be able to predict the operational challenges and possible solutions, costs, and GHG reductions associated with a 50 percent RPS. The two primary issues—ramping up to meet evening demand and managing overgeneration on low-load days—were illustrated in the well-known CAISO “duck curve” chart. But it shows only a single spring day over a time period in which the share of renewables grows to 33 percent (2012 through 2020), so it provides no insight into these problems in the following years.
REFLEX allowed us to understand how demands on the grid would change as the share of renewables grew through 2030. Two innovations make it more accurate and efficient than other production simulation models. First, REFLEX uses weighted day-type draws instead of a single hourly chronological simulation. This ensures that the model captures appropriate quantities of challenging and normal operating days. Second, it relies on a mathematical relationship between expected outages and reserves that is derived from one-minute data to determine the optimal level of operating reserves within each hour of each day.
We used REFLEX to simulate bulk power operations, emissions, and costs in four high-renewable energy cases, each a different mix of solar, wind, and conventional generation. The simulations modeled thousands of days for each scenario, using a comprehensive range of historical and simulated data on load, operating reserve requirements, and wind, solar, and hydro output. We also accounted for changes to public policy, modifications to existing gas plants, and advances in grid operations and energy storage technologies.
Contrary to industry assumptions, the model showed that overgeneration was a far bigger challenge than ramping (see the overgeneration “heat map” below). To avoid reliability issues caused by too much energy flowing onto the grid, utilities would need to curtail renewable energy as the share of renewables rose toward 50 percent. Low utilization of new renewable facilities would make the 50 percent RPS expensive—and it would not be a cost-effective GHG mitigation measure.
Even so, we found that reaching a 50 percent RPS would be less expensive than most stakeholders expected if utilities and regulators implemented some or all of the grid integration solutions we identified. These would cost less than paying renewable generators to curtail output.
Our analysis showed that the most cost-effective solution for achieving a 50 percent RPS is increased regional coordination, which allows California to sell surplus renewable output to neighboring states and to draw on their resources to manage ramps (see the comparative charts below).
A cost-effective roadmap to the low-carbon grid
The RPS study provides “valuable insights on the challenges that expansion of the RPS is likely to bring and [points] to some ways to address those challenges,” wrote the advisory panel in its report. “[It] helps to clarify the state of technology, costs and knowledge today, while acknowledging the considerable range of uncertainty in how these critical factors will evolve over the coming decades.”
E3, working closely with utilities, policy makers, and market operators, demonstrated that California utilities can meet a 50 percent RPS mandate by 2030 and outlined steps to prepare the grid for more renewable resources. The most important early step is for state policy makers to start working toward better regional integration. Additionally, utilities should procure a diverse renewables portfolio, begin work on storage solutions, and develop advance demand response, including smart charging of the state’s growing fleet of electric vehicles.
The recommended actions are underway already, including steps toward regional integration—the Western Energy Imbalance Market launched operations Nov. 1, 2014. And our findings allowed California to move ahead with SB 350, the climate legislation that mandates the 50 percent RPS by 2030.
Average overgeneration in 2030: 50% large-solar scenario
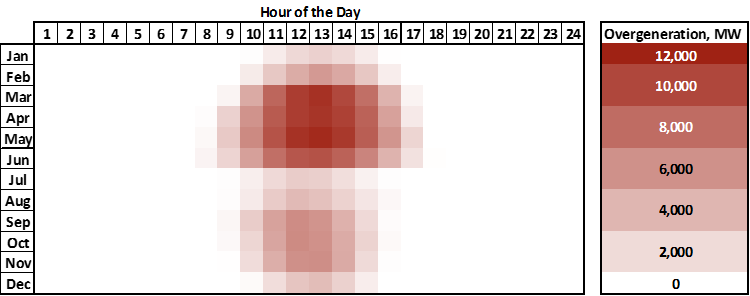
E3 examined conditions on thousands of simulated days to create this heat map showing the magnitude and frequency of overgeneration events at high renewables penetration in California.
Comparison of 50% large-solar scenarios
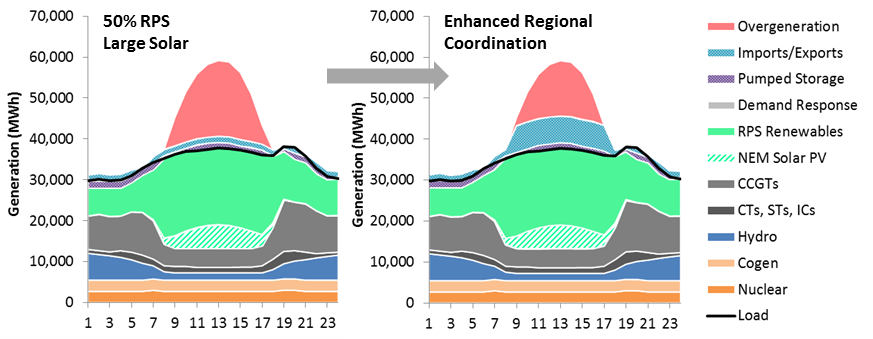
This chart shows how enhanced regional coordination reduces overgeneration, which lowers the cost of meeting a 50% RPS.
ALL E3 PROJECTS